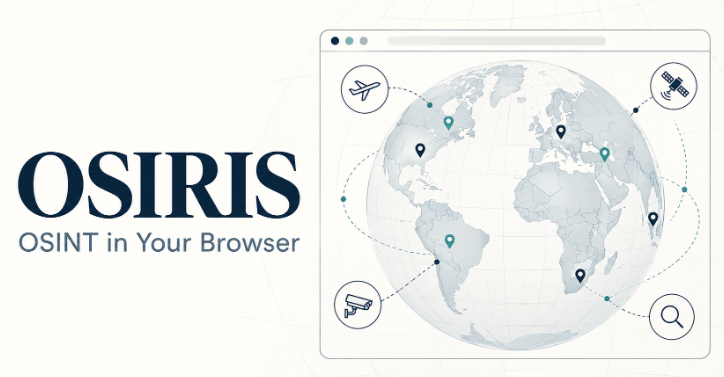
Public information becomes useful when you can connect it to a clear investigation question. A map marker, domain record, or news report may offer a lead, but its value depends on where it came from, how recent it is, and what it actually proves. OSIRIS brings several of these information sources into one visual workspace. Its combination of geographic context and reconnaissance tools makes it an interesting project for security professionals exploring how public data can support investigations. This article explains its documented capabilities, suggests a practical evaluation workflow, and examines the checks needed before using its output in an assessment.
What Is OSIRIS?
OSIRIS stands for Open Source Intelligence & Reconnaissance Integrated System. The project describes a global dashboard combining aviation, public cameras, environmental events, news, and reconnaissance. Its repository uses the MIT licence. Open-source intelligence, or OSINT, is the process of collecting and evaluating publicly available information to answer a specific question. Collecting information is only part of that process. Analysts still need to verify sources, resolve conflicting observations, and explain uncertainty.
For a pentester or security researcher, the useful question is whether an observation helps establish asset ownership, identify something worth investigating, or understand the environment around an engagement.
Why Is OSIRIS Attracting Attention?
At the time of review, GitHub displayed approximately 10,000 stars and 2,100 forks. These show substantial community interest, although they do not establish user numbers or a global growth ranking. The appeal is understandable: a visual workspace gives newcomers a tangible way to explore information that would otherwise be scattered across different services. For experienced practitioners, its potential value lies in reducing the effort needed to orient an investigation.
That value should be measured against a concrete task. Can an analyst identify the original source quickly? Can they distinguish a fresh observation from an old one? Does the interface make uncertainty visible? Those questions are more useful than judging a platform by how much data appears on its screen.
What Does the Platform Include?
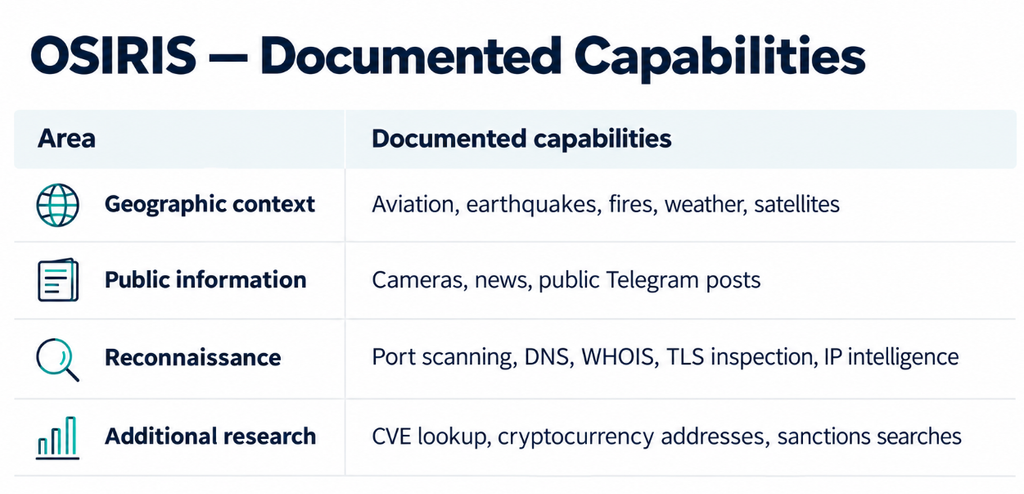
The documentation labels maritime and conflict information as static in its capability table. It also specifies that Texas camera feeds are refreshing JPEG snapshots rather than video. A moving interface should therefore not be interpreted as proof that every layer is live.
Where Does the AI Fit?
The package manifest includes Google’s generative AI SDK. When evaluating any AI feature, ask it to show the evidence behind its answer. A useful summary should preserve source links, timestamps, and disagreements between sources. If it produces a conclusion without that context, use the conclusion as a lead for further research.
A practical evaluation is to choose an event for which you already have reliable documentation, compare the generated explanation against that material, and record omissions or unsupported statements. This gives you a more meaningful basis for trust than a convincing demonstration alone.
A Simple Visit With No Local Setup Required – What Can You Explore on the OSIRIS Website?
The main benefit for a first-time visitor is access through the browser. You can start by exploring the hosted dashboard before deciding whether a local deployment would add value. The sections below connect the project’s documented capabilities to practical research questions; availability depends on the hosted service and its upstream sources.
Explore geographic information
Start with a region and one topic. For example, use an environmental event as a starting point for asking where an incident occurred, when it was reported, and which nearby areas warrant further research. Avoid enabling every information layer at once. A focused view is easier to interpret, especially when several types of markers overlap.
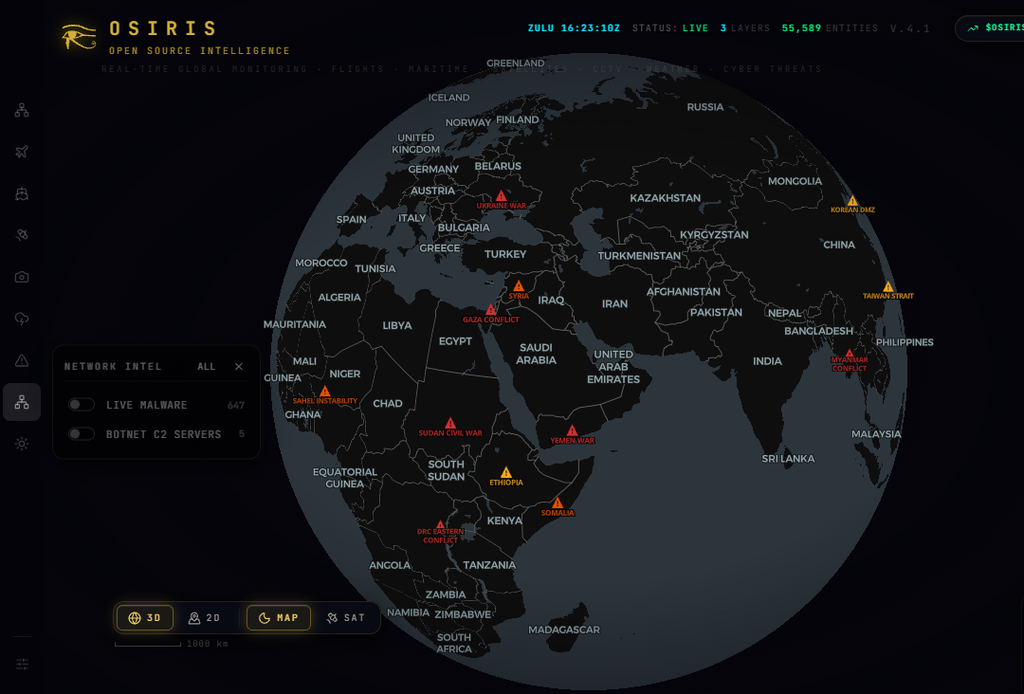
Record the source and timestamp behind an interesting observation before moving to the next one. Suggested exercise: Select one publicly reported earthquake and compare the location and event time with the original reporting source. Your outcome should be a short, verifiable event note rather than a screenshot without context.
Explore aviation and space information
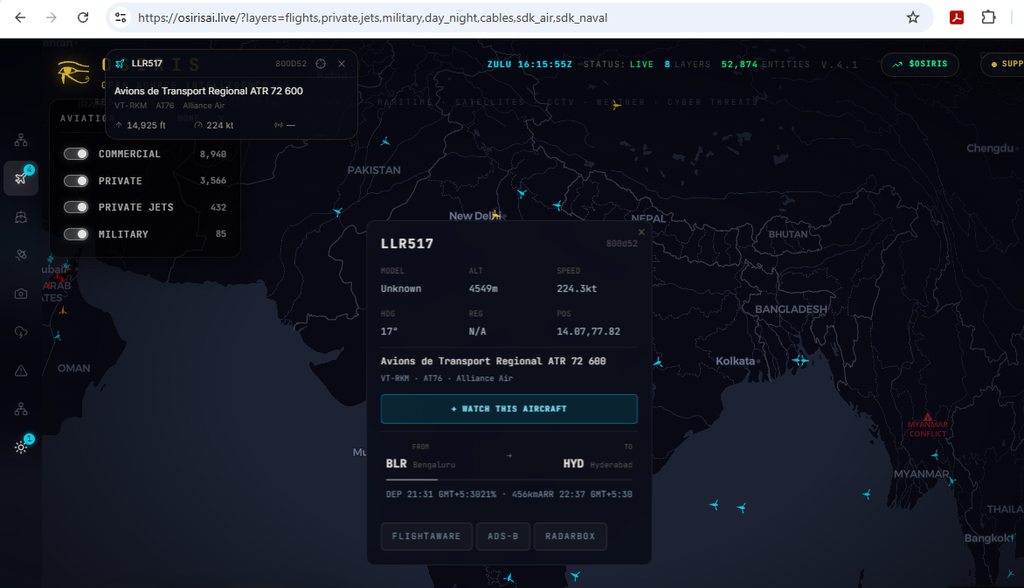
The hosted page advertises flight and satellite monitoring and exposes a SPACE control. These are areas readers can explore directly from the website. A useful beginner exercise is to inspect the details available for a displayed object and ask what each field represents. Distinguish a reported position from an estimate, and check the observation time before describing movement as current. A label on a map alone should not be used to infer the purpose of a journey or activity.
View public cameras and follow news leads
The project documents public-camera and news features. These can support an investigation by giving you a starting point for checking what a location looks like or finding reporting associated with an event. For a camera view, check whether the image changes, whether a timestamp is present, and whether the source is identifiable. For news, open the original publisher where possible and separate the publication date from the date of the event being discussed.
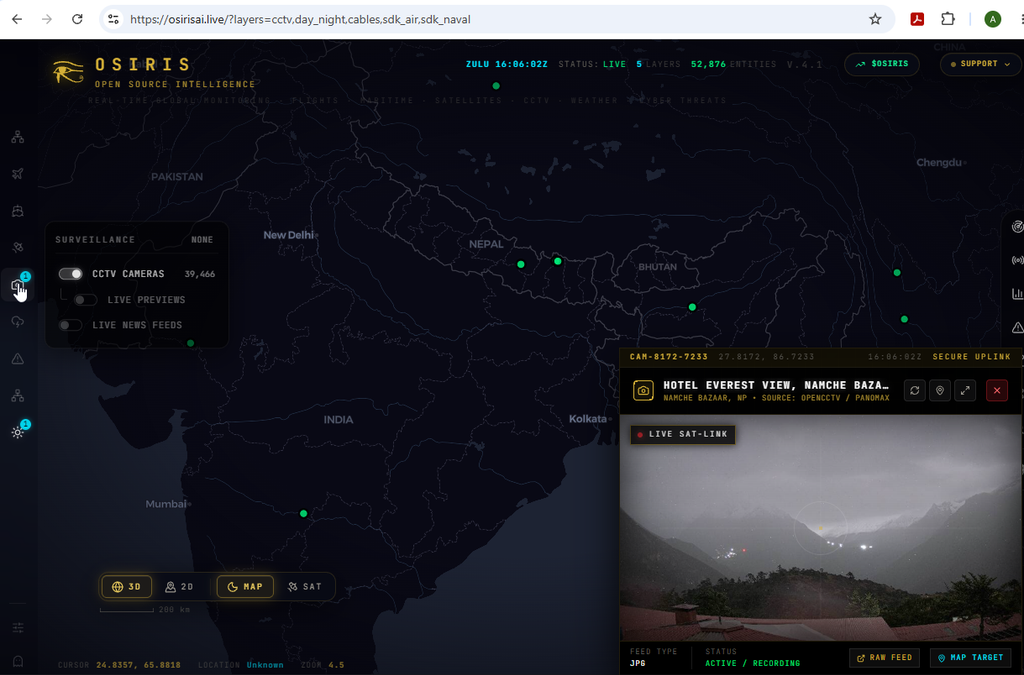
Suggested exercise: Choose a public location and compare a camera observation with a related weather or news report. Write down whether the two sources describe the same place and time. This is a research exercise, not an assumption that the website automatically correlates them.
Explore the RECON workspace
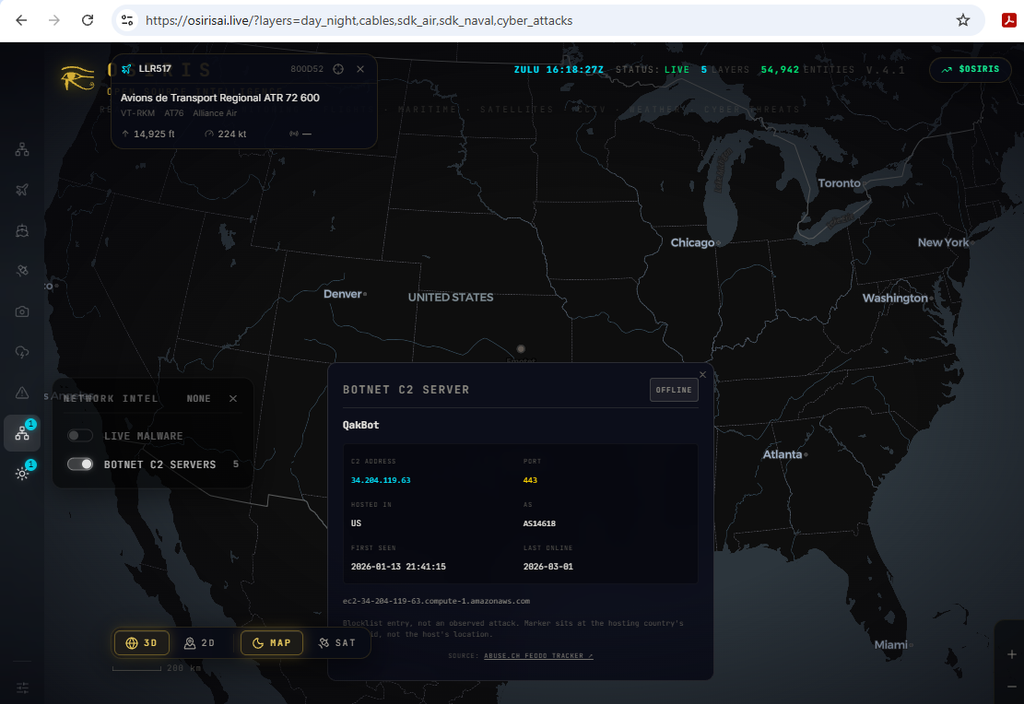
The website exposes a RECON entry point. For a security researcher, this is a natural area to inspect when moving from a geographic overview toward research on an approved domain or IP address.
Use the capability table above to identify the documented lookup types, then check which options the hosted instance currently makes available. Start with a question such as identifying the organisation associated with an address or reviewing the records associated with an approved domain.
Keep the output tied to the input you supplied. An IP address may represent shared infrastructure, while a registration record may identify a service provider. Neither automatically establishes ownership of every connected asset. Active scanning is a separate assessment action. Before running it, confirm scope and where the hosted scanner originates its requests. Browsing the website does not require you to launch a scan.
Inspect additional research options
The documented research areas include CVEs, cryptocurrency addresses, and sanctions information. Where the hosted instance exposes these options, approach each with a specific question and preserve the underlying reference.
For a CVE result, identify the affected product and applicability conditions.
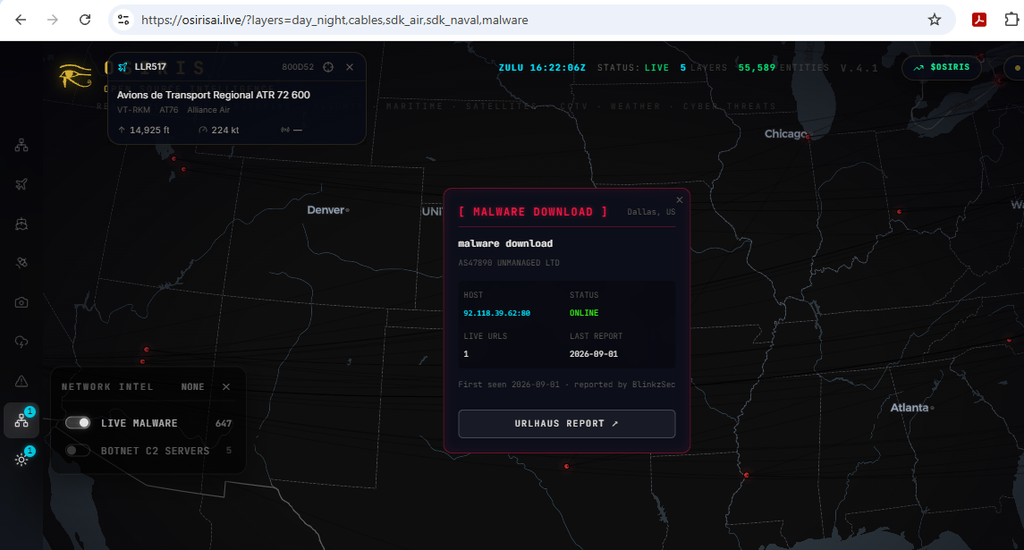
For an address or name match, verify the exact identifier and supporting context before drawing a conclusion. Similar names and related records are leads that need interpretation.
The homepage also exposes MARKETS, ALERTS, DRAW, ROUTE, SEARCH, ARCGIS, and REMOTE controls. Their presence was visible in the retrieved page, but their detailed behavior was not verified in this review. A menu label should not be treated as evidence that a particular integration or action is operational.
Optional: When Self-Hosting Makes Sense
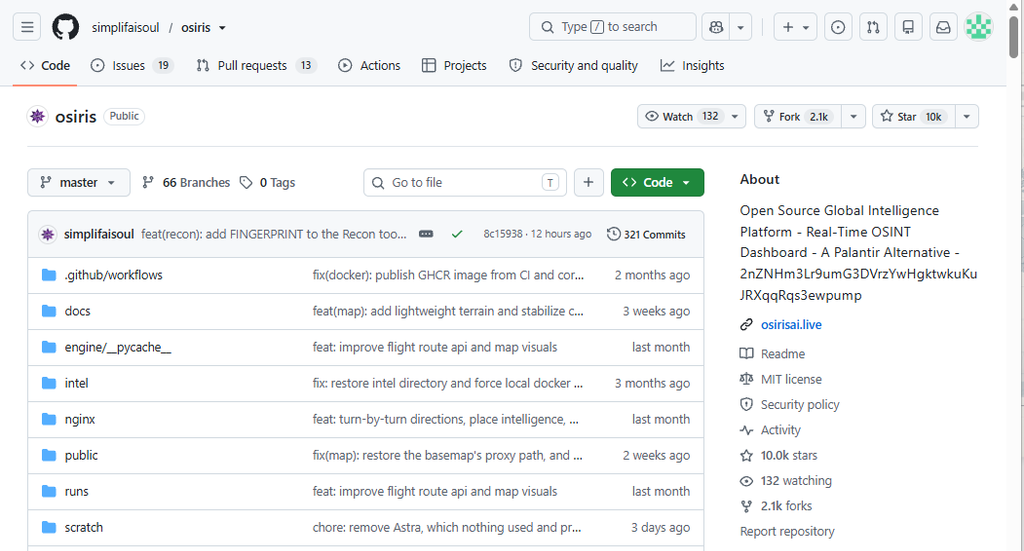
Start with the public website if your goal is to learn the interface and explore its research possibilities. Consider self-hosting later if you need to inspect or modify the code, manage a deployment, or evaluate integrations under your own administration. The project provides a Docker deployment guide. Its documentation also explains that the scanner backend needs separate configuration. Installing the dashboard alone does not make every reconnaissance function operational. Self-hosting is not an offline guarantee: public feeds still depend on external sources. Review those connections and your handling of engagement data before using a deployment for sensitive work.
The OSIRIS website is the most accessible place to begin exploring the project. Readers can approach it as a browser-based research workspace, choose a topic, and follow the information relevant to their investigation without first working through a deployment guide. Begin with one practical question and a small set of sources. Check what each observation establishes, keep its timestamp and origin, and build your conclusion from evidence you can explain. Once that workflow proves useful, self-hosting becomes a separate decision about control and customisation.